News
News
Jul 9, 2023
Jul 9, 2023
ChatGPT: Code Interpreter for Data Analysis and Visualization
ChatGPT: Code Interpreter for Data Analysis and Visualization
ChatGPT: Code Interpreter for Data Analysis and Visualization
As an Product Manager, I’m always looking for ways to leverage data to improve the performance and user experience . That’s why I’m quite excited at some of the new Code Interpreter feature that ChatGPT has recently introduced.
One of the main challenges of data analysis is to understand and analyze the data collected from user interactions. To achieve this, AI Product Managers or Data Analysts usually use tools that can help them process, clean, explore, and visualize the data to gain insights.
That’s why now with ChatGPT, you can do data analysis and visualization with data upload, data cleaning and data visualization.
Data Upload
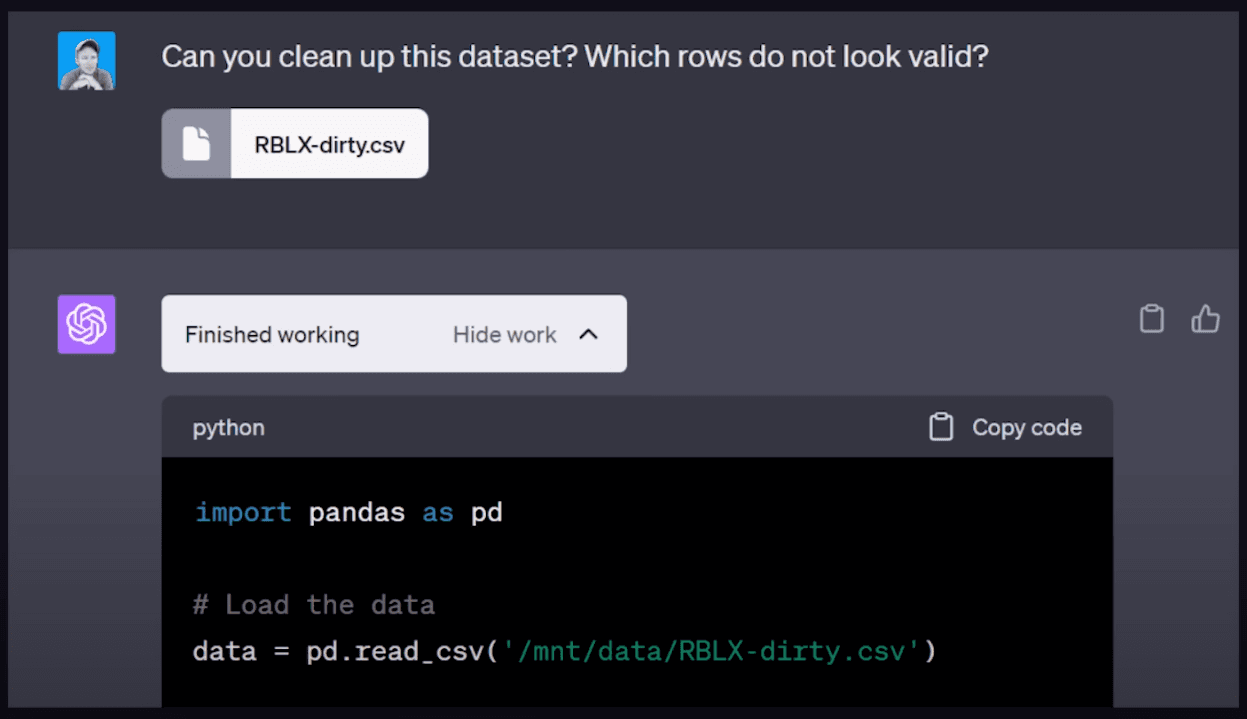
You can now upload your data to ChatGPT from various sources, such as CSV files, Excel files, Google Sheets, or JSON files:
Data Cleaning
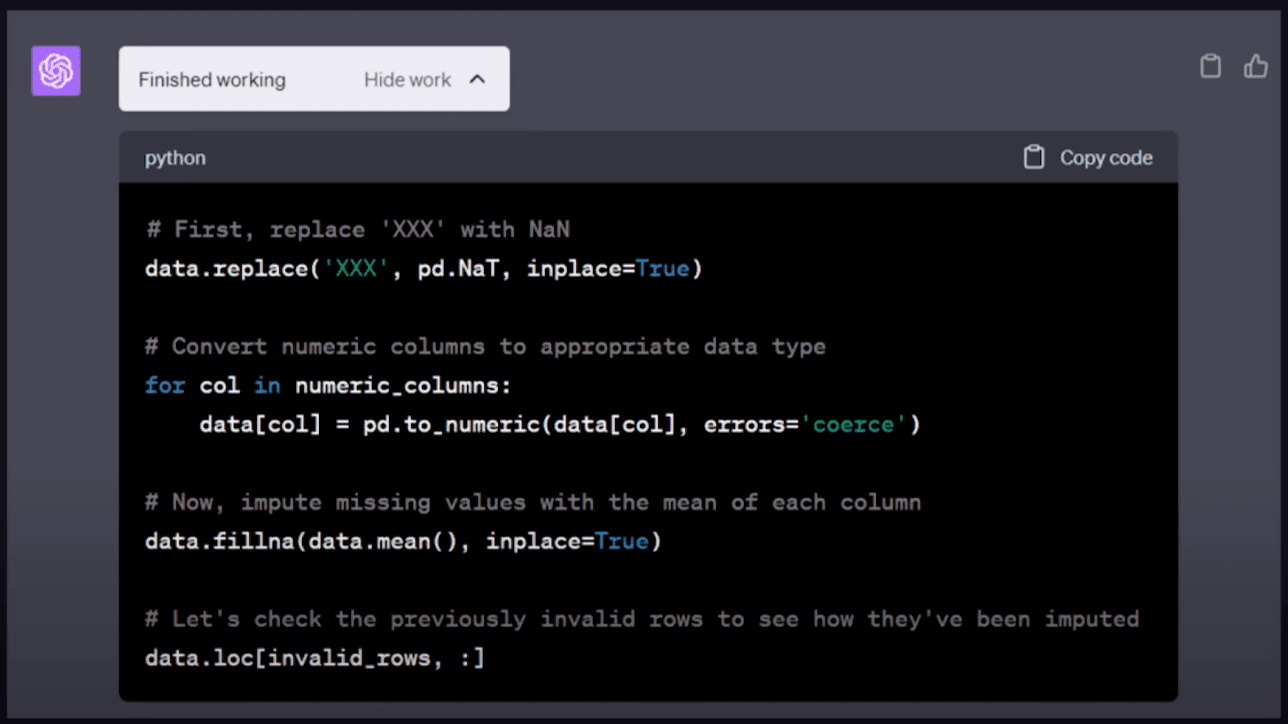
Data cleaning is a way to remove or correct errors, inconsistencies, duplicates, or missing values from your data. You can use ChatGPT to improve the quality and accuracy of your data. For example, you can use it to:
Remove or replace typos, spelling mistakes, grammatical errors, slang, abbreviations, etc.
Remove or replace irrelevant, sensitive, or offensive words or phrases.
Remove or fill in missing values or empty fields.
Remove or merge duplicate records or entries.
Data Insights & Visualization
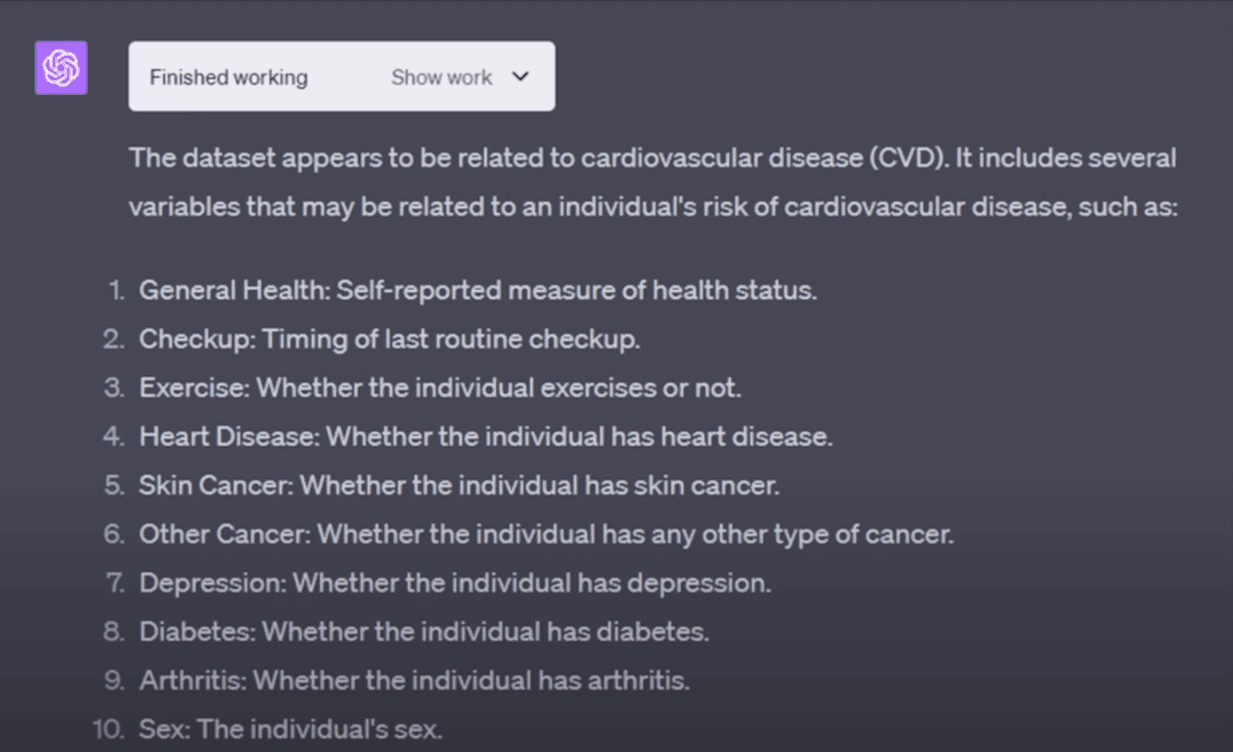
Data insights are a way to generate insights from your data. You can ask questions about your data and get answers. For example, you can:
Ask for descriptive statistics, such as mean, median, mode, standard deviation, etc.
Ask for correlations, trends, outliers, anomalies, etc.
Ask for comparisons, contrasts, rankings, etc.
Ask for predictions, recommendations, suggestions, etc.
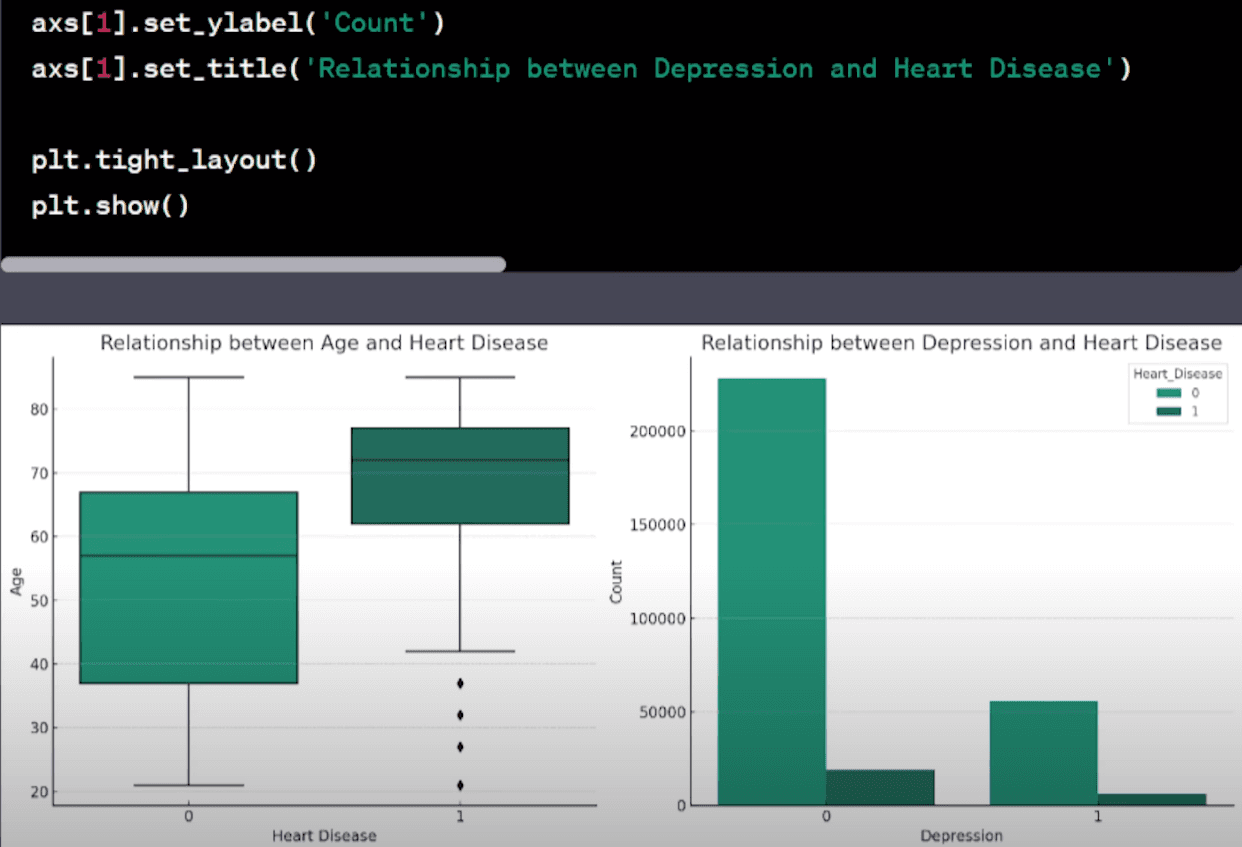
ChatGPT can also provide visualizations that can help you understand and communicate your data better. You can choose from various types of charts, such as bar charts, pie charts, line charts, scatter plots, etc.
How to enable it?
I hope you find these new features useful and exciting. I believe that ChatGPT is a great tool for data analysis that can provide valuable insights to product managers and data analysts alike. If you want to try it out yourself as a Plus user, you can follow these steps:
Launch ChatGPT
Click on your username in the bottom left corner
Select ‘Settings’
Then click ‘Beta Features’
From this menu, activate the features you wish to use.
As an Product Manager, I’m always looking for ways to leverage data to improve the performance and user experience . That’s why I’m quite excited at some of the new Code Interpreter feature that ChatGPT has recently introduced.
One of the main challenges of data analysis is to understand and analyze the data collected from user interactions. To achieve this, AI Product Managers or Data Analysts usually use tools that can help them process, clean, explore, and visualize the data to gain insights.
That’s why now with ChatGPT, you can do data analysis and visualization with data upload, data cleaning and data visualization.
Data Upload
You can now upload your data to ChatGPT from various sources, such as CSV files, Excel files, Google Sheets, or JSON files:
Data Cleaning
Data cleaning is a way to remove or correct errors, inconsistencies, duplicates, or missing values from your data. You can use ChatGPT to improve the quality and accuracy of your data. For example, you can use it to:
Remove or replace typos, spelling mistakes, grammatical errors, slang, abbreviations, etc.
Remove or replace irrelevant, sensitive, or offensive words or phrases.
Remove or fill in missing values or empty fields.
Remove or merge duplicate records or entries.
Data Insights & Visualization
Data insights are a way to generate insights from your data. You can ask questions about your data and get answers. For example, you can:
Ask for descriptive statistics, such as mean, median, mode, standard deviation, etc.
Ask for correlations, trends, outliers, anomalies, etc.
Ask for comparisons, contrasts, rankings, etc.
Ask for predictions, recommendations, suggestions, etc.
ChatGPT can also provide visualizations that can help you understand and communicate your data better. You can choose from various types of charts, such as bar charts, pie charts, line charts, scatter plots, etc.
How to enable it?
I hope you find these new features useful and exciting. I believe that ChatGPT is a great tool for data analysis that can provide valuable insights to product managers and data analysts alike. If you want to try it out yourself as a Plus user, you can follow these steps:
Launch ChatGPT
Click on your username in the bottom left corner
Select ‘Settings’
Then click ‘Beta Features’
From this menu, activate the features you wish to use.